
[This post is available in pdf format, sized for small and medium screens.]
Lewis Carroll Epstein wrote a book Relativity Visualized. It’s been called “the gold nugget of relativity books”. I wouldn’t go quite that far, but Epstein has devised a completely new way to explain relativity. The key concept: the Epstein diagram. (I should mention that Relativity Visualized is a pop-sci treatment.)
Here’s how Epstein introduces his idea:
Why can’t you travel faster than light? THE REASON YOU CAN’T GO FASTER THAN THE SPEED OF LIGHT IS THAT YOU CAN’T GO SLOWER. THERE IS ONLY ONE SPEED. EVERYTHING, INCLUDING YOU, IS ALWAYS MOVING AT THE SPEED OF LIGHT. How can you be moving if you are at rest in a chair? You are moving through time.
This is both poetic and (I feel) unnecessarily mystifying. Let me quickly add: Epstein does not want you to take this literally. It appears in a chapter titled “The Myth”, where Epstein advocates for “myths”—I’d call them analogies—to help us grasp the basic concepts of physics. You can’t argue with that. (Well you can, but you shouldn’t.)
I’ll undertake demystification in a moment. But first, here’s the prototypical Epstein diagram:
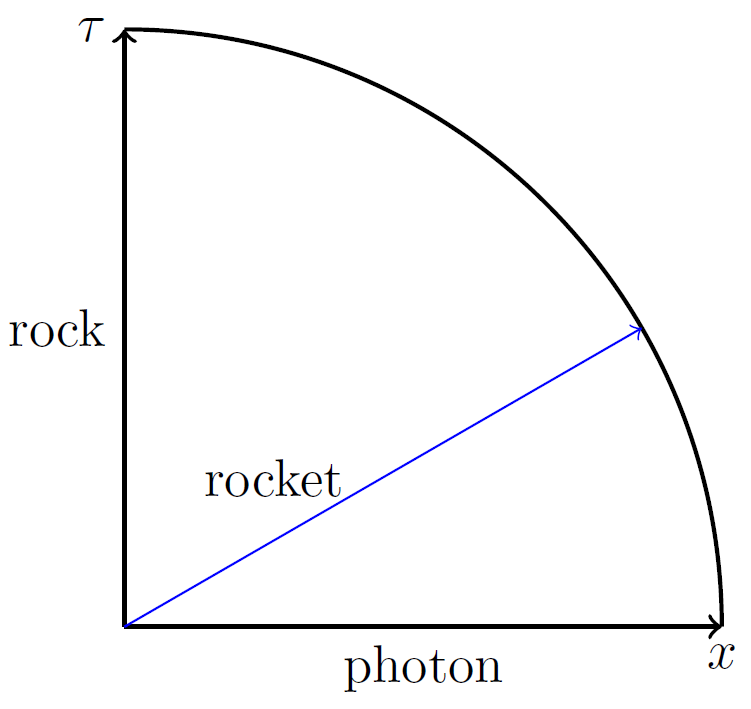
As with Minkowski diagrams, we ask two spatial dimensions to leave the room so we can draw things on a 2D screen. Note that the vertical axis is labeled τ, for proper time. In a Minkowski diagram, this would be labeled t of course.
The rock, the rocket, and the photon all enjoy a mythical speed of 1 (setting c=1, as usual). Our rock sits still (in the lab frame, let’s say). So its mythical speed consists entirely of motion through time. The photon travels through space as fast as possible, with nothing left over for motion through time. Its elapsed proper time is zero. The rocket devotes some mythical speed to spatial motion, some to temporal motion. I’ve illustrated the case where dx/dt=√3/2, so in one coordinate second it covers approximately 0.87 light-seconds of distance and 1/2 second of proper time.
OK, what’s really going on? Start with the Minkowski metric
dτ2 = dt2−dx2
and rewrite it
dt2 = dτ2+dx2.
Hey, that looks just like the Pythagorean formula! Can we banish the strange non-euclidean features of Minkowski space, and revert to good old high-school geometry?
Of course not. There’s a fly in the ointment. Unlike dt and dx, dτ is not an exact differential, so you can’t use (τ,x) as a coordinate system for spacetime. Not if you want a 1–1 correspondence between events and coordinate pairs. You can use τ as a coordinate along one worldline, however (provided the particle keeps below the speed of light).
Think of Epstein diagrams as a graphical calculation technique. Say we have the worldline of a particle
x=f(t).
So long as the particle obeys the speed limit, τ is a strictly increasing function of t. That means you can also give the particle’s position as a function of its proper time:
x=g(τ).
The graph of g is the Epstein diagram. Since dt2 = dτ2+dx2, the (ordinary euclidean) length of the curve is the elapsed coordinate time.
For example, look at this diagram, illustrating the twin paradox:
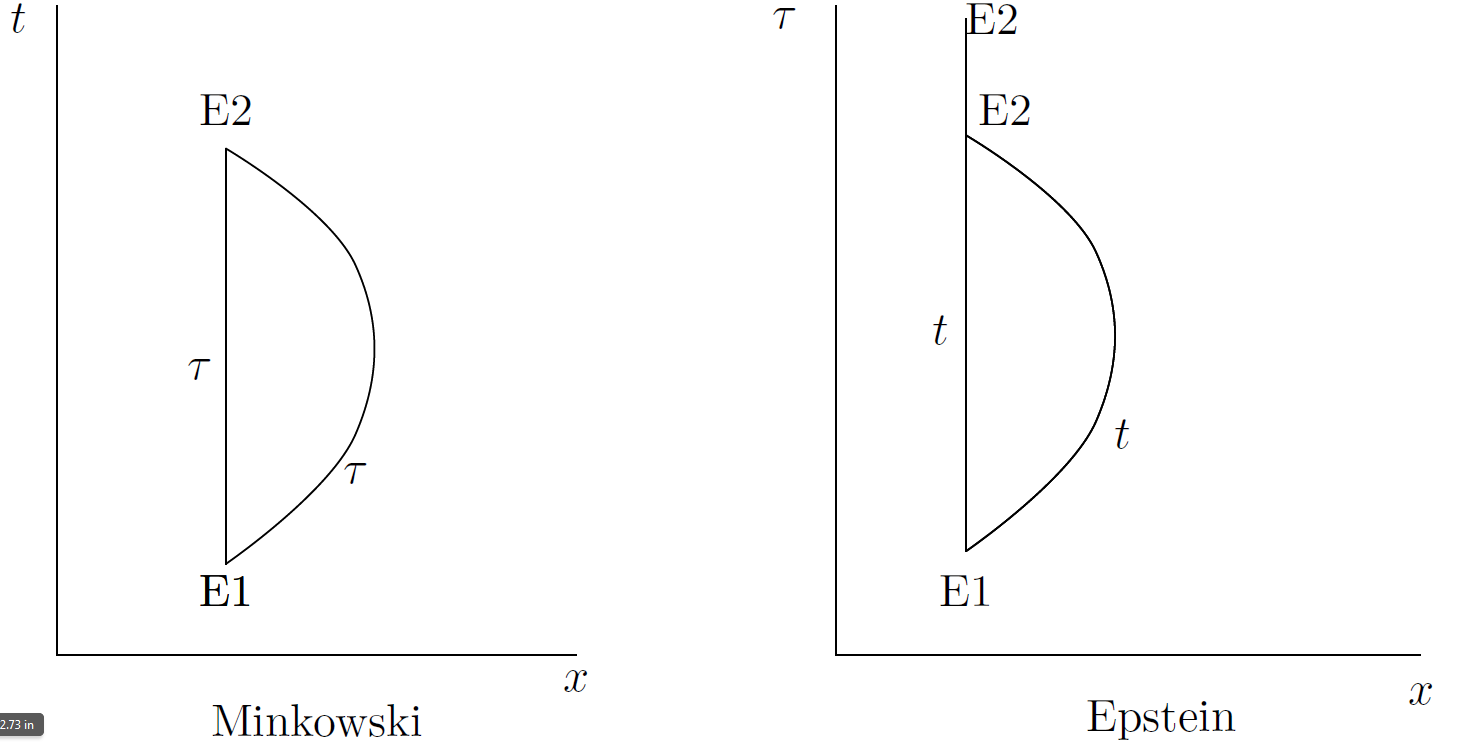 With our familiar Minkowski diagram, we have points E1 and E2 for the events “twins bid each other farewell” and “twins joyfully reunite”. The elapsed time for the stay-at-home twin Terrence is longer than for his adventurous sister Stella, even though it’s shorter in the diagram.
In the Epstein diagram, we draw curves for gTerrence and gStella, starting at the same point. Both curves have the same length, representing the coordinate time between E1 and E2. As you can clearly see, Stella ages less between E1 and E2 than Terrence.
Epstein uses a variation to explain length contraction. Once again, he obscures what is really going on by expressing the matter “mythically”. Let’s consider a station-train scenario, standard ever since Einstein. A train whizzes past a station. The stationmaster wants to measure the length of the train. This amounts to measuring the distance between two events, one at the front of the train (call it E for Engine), and one at the rear (C for Caboose). C and E must be simultaneous for the stationmaster. C and E won’t be simultanous for the passengers on the train, but they don’t care: in their reference frame, the train is not moving, so the distance between any two events, one at the front and one at the rear, equals the length of the train.
C and E have a spacelike separation. For such event pairs, the Minkowski metric is written like so:
ds2 = dx2−dt2
The interval ds is a relativistic invariant, so using passenger coordinates:
ds2 = dx′2−dt′2
Rewrite this as
ds2 + dt′2 = dx′2
and illustrate it with this diagram:

Now, dx′ is the passengers’ measurement of the train-length, while ds is the stationmaster’s. (Since C and E are simultaneous in his frame, he has dt=0 and ds=dx.) Sure enough, ds looks shorter than dx′; what you expect from the word “contraction”. In the Minkowski version of this diagram, the hypotenuse is labeled dx and the bottom leg is labeled dx′; the vertical leg is still labeled dt′. Visually dx′ looks shorter than dx, but it’s actually longer in the Minkowki metric. Our eyes, of course, see a Euclidean world.
(Epstein’s illustrations for length contraction offer more pizzazz than mine, but he labels the axes in a misleading manner.)
I fear this demystification might undersell the charms of Relativity Visualized. Epstein exploits his diagrams to the hilt when he gets to General Relativity. I particularly like his explanation of the Shapiro time delay.
Epstein has other arrows in his quiver: a fluid writing style, a gift for analogy, and artistic talent (he drew all the illustrations). I award this book the Silver, if not the Gold.

What exactly do you mean when you say that d(tau) is not an exact differential?
A differential form θ is exact if it is the differential of a function, i.e., θ=df for some function f. For closed forms, this is equivalent to path-independence of the integral: if E1 and E2 are two points, and P and Q are paths both going from E1 to E2, then ∫P θ=∫Q θ.
In the context of Minkowski spacetime, dt is an exact differential because there is a function t defined on all of spacetime, and dt is its differential. (It is true that t depends on the choice of reference frame, but that doesn’t matter here.) Integrating dt along any path from E1 to E2 gives the difference in t at those two events.
In contrast, there is no function τ defined on all of spacetime such that dτ is its differential. Restricted to the worldline of a physical particle (one that always stays below the speed of light), there is such a function: the particle’s proper time. But path-independence doesn’t hold. If we have particles P and Q both going from event E1 to event E2, and they synchronize their watches to τ=0 at E1, then ∫P dτ is P’s watch-reading at E2, and ∫Q dτ is Q’s watch-reading also at E2. These will generally not agree (the twin paradox).
I think that Epstein’s diagrams can be developed and revealed to be much more useful. I have found the Lorentz transformations using Epstein’s diagrams, postulating a block universe (as seen in the eternalist model) https://www.youtube.com/watch?v=Uy3B_Uobeew&t=249s I will appreciate your comment.
riraldi@gmail.com
My first reaction was that your video is not using Epstein diagrams, but (basically) Minkowski diagrams. Nothing wrong with that, of course. But then I took a second look (see below).
In an Epstein diagram, there is no 1-1 correspondence between spacetime events and points in the diagram. (For example, in Fig. 5-11 of Relativity Visualized, where distinct points P and D represent the same event, the reunion of Peter and Danny.) Vertical distances in an Epstein diagram represent proper time τ, while in a Minkowski diagram they represent clock time t in the chosen reference system. The latter is what I see in your diagram at 7:07.
A key question: how would you draw the worldline of a photon? In an Epstein diagram, it is a horizontal line parallel to the x-axis. (See, for example, Fig. 5-10.) In the usual Minkowski diagram, it is a line with slope 1/c.
On a second look, it seems that you are referring to the diagrams 5.17 and 5.18 of Relativity Visualized, where Epstein explains length contraction. These do look like your diagrams.
Thank you for the interest shown. I use Epstein’s interpretation but reformed by the postulates stated. First of all, the fact that my diagrams are on a block universe where there is always a past, present and future, as in the eternalist model, each point is represented by an x and t coordinate of the block universe, the x coordinate indicates the point of the train line, and t is the time indicated on the event on the block, and will be shown by any clock that passes over this point and valid for any system.
An observer has a meter stick with which he sweeps this universe, at the C speed measured by a universal time, the stationary observer when sweeping will see the universe again and will assign the coordinates of the block of events to each event.
other observers will see this universe with an inclined meter stick and will indicate the coordinates according to the “Contiguity Rule” Two observer joined by a vertical line are in the same spatial point but have different time coordinates.
Of course, a photon will have a vertical line always indicating the same time throughout the entire journey. I hope with this I have better clarified my time-universe model. I am at your disposal for any clarification. thank you
Renato
Epstein has a couple of types of diagrams. My post refers to his diagrams introduced in Chapter 5 of Relativity Visualized, Figs. 5-5 through 5-16. As I explain, these diagrams don’t provide a 1-1 correspondence between spacetime events and points. Different points can refer to the same spacetime event, and different spacetime events can correspond to the same point.
Minkowski diagrams do provide such a 1-1 correspondence, and it looks to me like your diagrams do too. In fact, your diagrams look much like Minkowski diagrams. You label the points with position and time coordinates x and t. The “meter stick” is the line of simultaneity in a given reference frame. If you also drew the worldline of the spatial origin, I believe your diagrams would look exactly like Minkowski diagrams.
Your diagrams also look much like Epstein’s diagrams in Figs. 5-17 through 5.19, which Epstein uses to explain length contraction, but not that clearly, in my opinion.
Did you mean to write that a photon will have a vertical line?
My diagrams are not the same as Minkowsky diagrams. My diagrams represent an instrument for assigning to each event in a block universe (a page of points) the coordinates of space and time for a still observer and a moving observer.For the still observer, a horizontal meter stick is taken that sweeps the universe at C speed, to each event-point it is assigned the spatial coordinate (x) that marks the meter stick and the temporal coordinate that is equal to the height, from the point where they have been taken the origins of coordinates of both reference systems, divided by the speed of light, this time is equal to that of the background universe. 1-1 correspondence is ensured.
A vertical line represents all events in the same place but differ in the measurement of time. A horizontal line represents points that mark the same time.Another reference system is another meter stick but inclined at an angle @, as you say it is a simultaneity line, but it is placed along the train. They intersect at a point that will be the origins of the meter sticks.This coordinate system sweeps the universe in the background but moves perpendicular to the stick.An event-point will be at a height h and a distance x, let’s say to the right. The coordinates of this event will be (x,t=h/C).The point x’ on the meter stick of the train is found like this: first the meter stick of the train is allowed to sweep for a time t, then the point is found where a vertical line from the event crosses the meter stick of the train, the coordinates will be x’ indicated by the meter stick and the time the height divided by C. (This time is the time that indicates the universe in back ground) (this time is the one that indicates the axis of the station that is common to the two reference systems. Loentz transformation can be seen on the diagram. In this interpretation the direction in which they sweep the universe is considered the direction towards their future. Each reference system has a future in a different direction.When the train advances towards its own future, seen from the station it is considered that it advances with a component in the direction of the future of the station C cos@. The other component moves the train forward in direction x from station C sin@. The greater the speed, the greater the angle, until for a photon the meter stick should be a vertical line.I thank you again. Without your help I would feel blocked.
Your first paragraph applies perfectly to a Minkowski diagram, with coordinates (x,t) with respect to a reference frame, called the station system.
For simplicity, let’s use units where the speed of light c=1.
Next you consider the train system, moving (I assume) at a uniform speed v with respect to the station. In the train system, an event will have coordinates (x′,t′). A “line of simultaneity” for the train system is given by t′=k, k a constant. The usual Lorentz transformation says that t′=γ(t-vx), so in the station system, this line satisfies t=vx+k/γ. So it is a line with slope v in the station system.
If v is positive, representing motion of the train to the right, then the train’s line of simultaneity (when plotted by the station system) will slope upwards going from left to right. However, you show it sloping the other way. I’m not sure if your conventions are different—is the train moving rightward according to the station system?
You write:
I don’t know what you mean by “background” here. You use the phrase “this time” twice; do they mean the same thing? And how is a time an axis of the station? What axis is “common to the two reference systems”?
You say
That means, I presume, that the worldline of the photon is a horizontal line. But this means that the station system would regard them as simultaneous! In other words, no elaspsed time between them. But that makes the speed of light infinite!
I am making a more detailed video. I will send you.
I want to clarify this issue of the 1-1 correspondence between events and points. In a Minkowski diagram, before we draw any axes or introduce any reference frames, each point represents exactly one event, and vice versa. Coordinate axes represent reference frames. So, the station system will assign coordinates (x,t) to an event (represented by a point A), and the train system will assign coordinates (x′,t′). But regardless of the reference frame, the same point A represents the event.
That means that a worldline is the same for all reference frames—the same curve in the diagram. The events of the worldline will have different coordinates in the two systems, but there is only one curve.
This isn’t true for Epstein, and I’m not sure if it is true for you.
The twin paradox diagrams are key here. Let’s look at a variation, where we replace the traveling twin with a photon bouncing off a mirror. So: event A is the photon leaving the (spatial) origin of the station. It travels (say) one light-second to the right, bounces off a mirror, and returns to the origin. Total elapsed time, as measured by the station system: 2 seconds. Its worldline, in a Minkowski diagram, is a broken line, i.e., a line segment at 45°, followed by a line segment at 135°. Let’s call that worldline ABC, with B being the event “bounces off the mirror”, and C the event “returns to the origin”.
In an Epstein diagram, the worldline of a photon is always horizontal. You say this is also true for your diagrams. So the worldline of the photon is drawn as a horizontal line from (say) A to M, followed by a horizontal line back from M to A. Here M of course represents the event of bouncing off the mirror.
Things to note:
This shows that it is impossible to have a 1-1 correspondence between events and points if we plot the worldline of photons horizontally.
I have to make some clarifications, first of all, no line represents a space-time graph. The background universe is a sheet, each point represents an event, past, present and future have the same reality. The horizontal black line is a meter stick, when an event crosses this meter stick its mark is the x coordinate of the event. The red line also represents a meter stick along the train, used to measure the distance from the point we chose as the origin. Since the time axis is vertical t=h/C. The passengers of the train are seated on the red meter stick, their watches read Gamma(-vx), for passengers on the left (negative x) positive measurement. For positive x measure to the right negative measure. The passengers on the left are in advanced times (future) the passengers on the left are behind times (they are in the past) When a little time passes, the black line (station) goes up Ct, the origin of the station is Ct up and its clock reads t, the red coordinate origin advances Ct in the direction perpendicular to the meter stick, it advances C cos@ up and Ct to the right, Ct cos@ is what his clock shows and Ct sin@ is what has advanced to the right = vt. for a photon his meter stick red must be a vertical line, the entire universe runs in zero time and advances C sin 90 to the right. I am working on twin paradox. and finishing the clarification video. I will send you
thanks for your interest.
You write, “The background universe is a sheet, each point represents an event”, which sounds like you do want a 1-1 correspondence between spacetime events and diagram points. One point for each event, and one event for each point. This creates problems with the Epstein approach.
I have come to this conclusion: your 1-1 correspondence between events and points depends on the reference system—station or train. The horizontal black line, or meter stick, represents the stationary system. The red line, or meter stick, represents the train system. Given one event, the two systems will assign different points to it.
Let us start with the stationary system. We agree that it will assign (x,t) coordinates to each event. Now let’s look at the red line, but (for the moment) still from the viewpoint of the stationary system.
You write, “The passengers of the train are seated on the red meter stick, their watches read γ(−vx)”. I’m not sure what this means. The points in the diagram represent events, not passengers. A passenger will have a worldline consisting of infinitely many events. For a given passenger, only a single event occurs at the red line. Likewise, only a single event occurs on the black line.
The equation t′=γ(t−vx) tells us that the events with t′=γ(−vx) occur on the x-axis, with t=0. To be concrete, we can think of it this way:
As you say, t′ is positive along the left half of the x-axis: “The passengers on the left are in advanced times (future)”. (By past/present/future, I assume we mean time<0, time=0, time>0.) But this is the present for the stationary observers: t=0.
What does the red line represent? It is a collection of points, so it represents a collection of events. It does not represent the train’s meter stick “throughout time”. One guess: the events with t′=0. But this is not correct. Since t′>0 on the left half of the x-axis, to get to t′=0 we have to go downward when left of the t-axis. Likewise, on the right we have to go upward. The train’s “line of simultaneity” t′=0 slopes upwards.
My second guess: since “The passengers on the left are in advanced times (future)”, that’s why you plotted red line above the black line in the left of the diagram. But “future” and “past” have no absolute meaning; they depend on which clocks (station or train) we are using. As noted above, these events are in the present for the station, and hence on the x-axis. It is true that the passengers call them future events because t′>0. But that doesn’t mean they get plotted above the x-axis.
Pick a particular passenger, and consider the event E=”the passenger passes by station position x at t=0″. The station system plots E on the x-axis. Plotting E on the red line above, means that you have two points representing the same event.
At the end of your paragraph, you describe the red meter stick sweeping through space time. This procedure does assign coordinates (x″,t″) to all events. The question is, what does t″ represent.
Consider first the red line in the station’s diagram. Because it slopes downward, it represents events with different values for t′. In other words, if the stationary observers take pictures of the passengers at those event-points, the passenger watches will have different readings. If the station and train diagrams share the same event-point correspondence, then t″=0 is not a line of simultaneity for the passengers.
If we want the red line to be a line of simultaneity for the train, we are forced to conclude: the station and train diagrams have different event-point correspondences.
Another possibility: the red line, in the train system diagram, should represent events with t′=γ(−vx). Again, this means that the same event will correspond to different points in the two systems, since in the stationary diagram all these events lie on the x-axis.
This is the fundamental difference between the Epstein and Minkowski approaches. With the Epstein approach, there is no frame-independent “background sheet”. The (diagrammatic) representation of events is tied to the choice of reference system. I think that’s a major drawback, and Epstein is not upfront with it. Of course, Epstein’s approach has other charms.
You write, “The passengers of the train are seated on the red meter stick, their watches read γ(−vx)”.
I imagine the meter stick in the station and an observer at each point of the meter stick with a clock, each observer can see the measurement in the meter and the time in his clock. The same for the train, in all points on the train I imagine an observer who can read the measurement on the meter stick and on his watch. These are the coordinates of the event.In my diagrams the world lines are not drawn, only a piece when we go from t=0 to a generic time t, in the diagram the line Ct. For example, for the origin of the station’s coordinates, the world line is a vertical line upwards, for every observer fixed at the station it is a vertical line upwards. For train passengers, the world line is a line perpendicular to the red meter stick, time grows as t’=t/gamma.
For a given passenger, only a single event occurs at the red line. Likewise, only a single event occurs on the black line. This is true for a certain time, as the meter sweeps the universe, all events on his world line are touched.Imagine each stationary observer takes a picture at t=0 of the passenger passing by him at that instant. In that picture, the passenger’s clock will read t′=γ(−vx).As you say, t′ is positive along the left half of the x-axis: “The passengers on the left are in advanced times (future)”. (By past/present/future, I assume we mean time<0, time=0, time>0.) But this is the present for the stationary observers: t=0.
yes you are in the present of the station, the coordinate origins both mark t=0 and t’=0, also x=0 and x’=0, but the man at the station at x=0 was able to tell the man in front x’=0 that “in my present (all observer have t=0 in the station) there is a person who can talk to a person who is in your future t’>0 and with a person who has already passed t<0”.
What does the red line represent? It is a collection of points, so it represents a collection of events. It does not represent the train’s meter stick “throughout time”. One guess: the events with t′=0. But this is not correct. Since t′>0 on the left half of the x-axis, to get to t′=0 we have to go downward when left of the t-axis. Likewise, on the right we have to go upward. The train’s “line of simultaneity” t′=0 slopes upwards.
The red line represents a stick that occupies the entire train, its points represent points on the train where there is also a clock, the clocks mark the time of the block universe over which the two meter sticks slide. In reality those points have different times.
I have four questions for you. Hopefully the answers will clarify things.
In general, for any event, let (x,t) be the coordinates assigned by the station people, from their meter stick and clocks. Let (x′, t′) be the results of the Lorentz transformation, so x′=γ(x-vt) and t′=γ(t-vx). Let (x″,t″) be the coordinates assigned by the passengers, from their meter stick and watches.
Here are my questions. They are about two points in your diagram. Point A is on the black line to the left. Point B is vertically above it, on the red line.
1.-yes (x’,t’) = (x”, t”)
2. and 3.- yes, these events represent events that I call contiguos, united by a vertical line (vertical line indicate same x coordinate of the background universe), they are at the same x coordinate of the background universe, They are nose to nose, one on the train the other in the station system. remember that the train is on the railroad line. the time coordinate on the train are: t’=-gamma* x*v and x’=-x*gamma =-x/cos @
4 A and B. They are events that occur in the same physical place but the clocks show different times.It is the same as with the Lorentz transformations: to the event (-x,t) this same event is (x’=-gamma*x , t’=(-gamma*x*v))
Different clocks show different times. So A and B represent the same event. If you and I shake hands, and my watch reads 12 noon and yours reads 1 pm, the “shake hands” event is just one event, not two. (Maybe I haven’t adjusted my watch for daylight saving time, and you have. Or maybe I just flew in from a different time zone, and haven’t reset my watch.)
So we have two different points in the diagram, A and B, representing the same event.
Note also that A and B will be assigned different x-coordinates by the passengers and the station people: x≠x′. But you still say that they occur in the same physical place. You don’t say that “their meter sticks indicate different places”. It’s exactly the same with watches. A and B occur at the same time, but the watches read different values.
This is why I say that you, like Epstein, don’t have a 1-1 correspondence between diagram points and events. Not one that is valid for both sets of observers.
It’s really no different from the situation in analytic geometry. Suppose we have an (x,y) coordinate system, and also a rotated set of coordinates (x′,y′). A single point A will have two pairs of coordinates. We don’t plot two points, one higher than the other if y′>y.
This doesn’t mean your diagrams are wrong, but like Epstein diagrams, they don’t have the 1-1 correspondence between points and spacetime events, independent of the reference system, that is a key feature of Minkowski diagrams.
I understand what you say, but my diagrams are not space time diagrams, my diagrams are the equivalent of what you say are diagrams of analytical geometry, there you have a point on the plane that can be specified with (x,y ) or (x’,y’) and has rules for the transformation of (x,y) into (x’,y’), these rules are calculated using geometry. In relativity these rules are the Lorentz transformations, My diagrams teach how to calculate these rules (the Lorentz transformations) using only the rules of geometry, I make a physical model that only assumes Epstein’s rule:
1.- the coordinate systems sweep the substrate (for him, four-dimensional space; for me, a block universe of events) at the speed of light.
https://qph.cf2.quoracdn.net/main-qimg-6b16e1de5a8706ef6ebf36b9d8b8b24c
With this postulate alone, Lorentz transformations can be demonstrated without mathematical calculations, using only a ruler and compasses.It is not necessary to postulate that the speed of light is the same in all coordinate systems, nor any experimental properties.Of course, for each point or event one has a pair of coordinates (x,t) for a stationary system, and the transforms (x’,t’) for a traveling system, as in analytical geometry.Minkowsky diagrams have different purposes.
https://qph.cf2.quoracdn.net/main-qimg-7703bfb7148e3444757e3b6b1465599a
Yes, I now understand that your diagrams are not spacetime diagrams. That’s another way of saying that you don’t have a 1-1 correspondence between events and points, at least not one that is the same for all observers.
Epstein’s diagrams are a graphical tool for calculation, and I think that also describes your diagrams.
I do find some things strange about your diagrams.
But in analytic geometry, we don’t plot two different points just because a point has two different coordinate pairs, depending on the Cartesian axes. For example, consider a point A with coordinates (1,1) in one system. If we rotate the axes 45° clockwise, the point A will have coordinates (0, √2) in the rotated system. We don’t draw an additional point at height √2!
However, given a point at (x,t) in the station system, you draw a point at (x,t′), representing the same event in the train system. What is the reason for this? And why change just the height: t→t′, but x stays the same?
I also find some of your language confusing. In your second comment, you wrote:
However, the station clock and the passenger clock show different readings for this event.
You also use the term “background” several times. Does this mean the same for you as “block universe”?
You also wrote:
The term “block universe” in standard usage refers to the collection of all spacetime events, independent of what reference frame you use. It’s really synonymous with “spacetime”. Is your “block universe” different from standard spacetime? Not just a different graphical representation, but something fundamentally different?
Finally, you wrote:
For any reference frame set up in the usual way (Einstein synchronization convention, etc.), the speed of light will be the same. Are you proposing a different theory, or just a different way of diagramming standard special relativity?
This whole discussion has inspired me to add an explanation of length contraction, à la Epstein, to my original post.
**Relativity and analytical geometry is different, but if you have a point P on a page, for a system of coordinates vertical x, horizontal y, you wil have the coordinates (x,y). if you turn an angle alpha the coordinate axes, you will have (x’,y’) this is another point in the old coordinate system, the transformation may be illustrated by a rotation of the vector 0P.
In my diagrams it is seen that time and space are different although they apparently play similar roles, for example all the points in my graphs, when covered by a clock, mark the time of the block of events that serves as back ground, above which the sticks slide.
In my diagrams three reference systems are distinguished, that of the universe block, that of the station system equal to the universe block. When the station sweeps it, what it does is repeat it. And the train reference system.
The back ground universe or block universe that I use is only to justify that the time marked by a train clock in a given event is equal to that of the block universe.
The difference between physical space and block of events, in addition to justifying the use of time, is to justify that when x and x’ are joined by a vertical line they represent the same point on the train line the same point on the rail road, otherwise we would not have justification for saying that x and x’ are the same event.
Not in my theory the speed of light is the same in all reference systems because it is the scanning speed, that is, the speed with which you move towards the future, but if you look at a system in motion, you only see that they are going towards your future with one component, the other component uses it to move away at speed v. The fundamental difference with the orthodox theory is that my theory proposes a physical model that in its developments the Lorentz transformations are discovered. To find the Lorentz transformation the orthodox theory is based on an experimental result; the speed of light is the same in all systems, this is not an understandable model.
I have a question for you. Are you an inteligent person or you are an artificial inteligence
No need to be insulting. The discussion has been polite on both sides up to now. But in a spirit of quid pro quo, I will say I now suspect that you are confused on several points.
This comment will explain my problems with what you’ve written. I will then allow you one more comment so you can have the last word (but keep it polite, please!). And that will be the end of the discussion.
This is a so-called active transformation: one coordinate system and two points (in the original and new positions). But our discussion till now has been about a passive transformation: two coordinate systems (or reference frames) used to describe one point (or event).
To repeat the example I gave: a point P at (1,1), which has coordinates (0,√2) in coordinates rotated clockwise by 45°. The analogy here is with an event assigned coordinates (x,t) by the station people, and assigned coordinates (x′,t′) by the passengers. That’s what the Lorentz transformation is all about. Not two different events!
I assume you mean here that x and x′ are events (as you say at the end of the paragraph), and not x-coordinates. So clearly you have two different diagram points representing the same event.
In other words, your diagrams, like Epstein’s, do not have a 1-1 correspondence between events and diagram points. Two points for one event! Nothing could be clearer. You seem to have a problem with this statement. As I’ve explained in my post and in comments, this doesn’t make Epstein’s diagrams (or yours) wrong. I really don’t understand your objection to this.
I have carefully read all your comments and studied your video. Your “model” remains quite unclear.
Even this basic question remains unanswered: are you proposing a physically different theory, or just a different way of looking at relativity? Different diagrams for standard relativity theory? Or a new physical theory?
You use the terms “block universe”, “background universe”, “universe block”, “station system” and “train system” without ever clearly defining them. At one point you say the block universe is “a page of points”, at another the “background universe is a sheet”. This sounds like they are representations of spacetime. Does the term “spacetime” even have meaning for you? Is the station system the same as the block universe, or is it one reference frame for assigning (x,t) coordinates—no more valid than the train system? At one point you say that “the station system [is] equal to the universe block”, apparently giving it a special status. You also write,
I have no idea what this means. There are no universal time-markers in spacetime. Events are assigned times only with respect to a reference frame.
One fundamental lesson of special relativity: all inertial reference frames are equally valid. None is primary. Spacetime is the background. Its events have an existence independent of reference frames. The metric also is frame-independent. But to get x and t values, you must choose a reference frame, and no reference frame is primary. I brought up analytic geometry because the analogy is perfect: points do not acquire x and y coordinates until we choose Cartesian axes, and any choice of axes is equally valid.
I cannot tell if you are confused on this basic issue, or just expressing yourself unclearly.
Of course, to draw a diagram, one has to make some (frame-dependent) choices. (True both for Minkowski and Epstein diagrams.) Perhaps you mean that the station system is primary just in this sense: the diagrammatic choice, carrying no physical significance. Or perhaps you regard it as physically primary. Again, I can’t tell from what you’ve written.
The usual account of relativity is perfectly understandable. Einstein’s original paper is a model of clarity, as is the Minkowski paper where he introduces his diagrams. The book Spacetime Physics by Taylor and Wheeler is justly famous for its lucid account of relativity using Minkowski diagrams.
In your video, you say
This is simply false. Thousands of thousands of students have learned, and understood, relativity using the usual approach. (The worldwide population of physicists is estimated at between 300,000 and almost a million. 50,000 is a conservative estimate for the number who understand special relativity, a standard topic in undergraduate physics.) I, personally, regard it as one of the crown jewels of physics.
I don’t see why you should take it the wrong way, I asked because you answer immediately, I answer very fast too, but because I am retired with no other activity, and even so I take more time than you do to answer.
You have no idea how grateful I am for your discussion, for dedicating your time to discuss my ideas.
I agree that there are a very large number of people who handle relativity with all their mastery.But the fact thatParadoxes like that of twins are still discussed, we can see it when the best popularizers of physics, Don Lincoln and Selene, have a controversy on YouTub. When many people wonder why the speed of light is the maximum possible, why dilation of time of a clock depends on the reference system that sees it? For example, a rocket passes at a very high speed in front of me, its clock dilates, but it dilates less compared to a third traveler who is going at half his speed. We wonder whether the contraction of measurements produces a physical effect or not, physicists are divided on this matter, many say yes based on relativistic Bell paradox, I am not convinced.
I think that to avoid confusion it is best to make a more practical model .Suppose you have a computer screen full of dots. The vertical bar on the screen on the left is a graduated ruler, indicating t. and the horizontal bar on the screen is also a ruler graduated in cm. We can assign a pair of numbers to each point on the screen (t,x). Now take a page of paper that covers the entire screen with a horizontal transparent crack, wide as a point. That crack also has a graduated ruler, now slide the crack upwards at speed C, you will see the points appear and you will assign the measurement of each one with the bar on the left, t, and the measurement in the ruler of the crack ,x, so we will assign (t,x), we will see that the assignment is the same as the previous one, we have read the screen again. The analogy is: (screen=block universe crack1 a given present on the station)
At the same time we make a crack (crack2) slide perpendicular to the crack2 at an angle alpha . When we find a point P in crack1, we assign a point B on crack2, joining point P with point B by a vertical line. Then from point B we have another pair of coordinates read on the vertical bar of the computer (t’) and on the graduated ruler (x’) of the crack2. (t’,x’). We see that the tranformation from one pair to the other is (t’,x’) via Lorentz (t,x). I hope you are not yet offended and we can continue this, for me, fruitful discussion.
thank you
You asked if I was an actual intelligent human, or a mindless program. I found that insulting.
However, I will take your word for it that you did not intend it that way. But this will be my last contribution to this discussion, as I have other things to attend to.
There are always people who have trouble understanding technical subjects. Many students have a lot of difficulty just with the basic concepts of Newtonian physics, like Newton’s 3rd Law. (Look up the work of Hestenes and his collaborators on the Force Concept Inventory. You can start with their paper in The Physics Teacher, Vol. 30, March 1992, 141-158.)
And on YouTube, you can find people who believe all kinds of crazy things. “The Earth is Flat!”, for example. So I don’t think this means that the standard account needs replacing.
I don’t know what you mean by this. The dilation factor γ strictly increases as the speed v increases.
For a clear explanation of the Bell paradox (if I do say so myself), see this webpage. It uses Minkowski diagrams.
Based on your last comment, I am assuming that you are not proposing a replacement for special relativity, just a new way of looking at it. That is also what Epstein was doing.
How much does your model help in understanding special relativity? Several features are assumed without explanation or motivation. Why should crack2 be tilted at an angle α? Why should it advance perpendicularly? Why the rule for plotting B vertically above point P? For that matter, why plot a second point at all?
The answer to all these questions seems to be, because then we can obtain the Lorentz transformation. This is so-called reverse engineering, and is unsatisfying. After all, we get the Lorentz transformation with the usual approach too, and Einstein’s postulates are well motivated.
The standard approach provides answers to a number of questions. For example:
I don’t see how your model helps with any of these. Perhaps you can work up explanations, but I am skeptical that they will be superior to the standard ones.
I think that Einstein’s original approach, supplemented by Minkowksi diagrams, still offers the best first introduction to special relativity. Epstein’s diagrams are a nice extra, but they do obscure some crucial features. I have layed out the pros and cons in my post, so I won’t repeat that.
May be that I have only a little knowledge of artificial inteligence People say that it is a superior intelligence and that it is very dangerous because it exceeds human intelligence, obviously I did not believe this, but being you a specialist in that, (if I’m not mistaken by searching the internet https://www.linkedin.com/in/michael-j-weiss-9522a8181/), I am convinced that what people say is myths.
I want to say that Don Lincoln and Sabine Hossenfelder (I have write selene I was wrong) are the most authoritative popularizers known in the USA, Also Carlo Rovelli, Nobel Prize winner, has popularizations about the nature of time. They are not amateur like me.The most recognized historian of science Professor Sean Carroll Explains Presentism and Eternalism. https://www.youtube.com/watch?v=MAScJvxCy2Y&t=366s
Last year at least 2 books on relativity were published in Italy, they use ideas from Epstein and eternalism that distinguish these books from those published previously. This indicates that there is a search for better understanding.
The example. Let’s put an observer (Bob) on Earth, Ann goes at 0.8 C to the right and Eva goes at 0.8 C to the left, Bob sees that they are moving away at a speed of 1.8 C, we see that speeds greater than C are possible, but an object cannot be measured from my reference system with a speed greater than C, because otherwise C would not be invariant, or to demonstrate the Lorentz transformations, reverse engineering, returning to the example, Bob sees that the clocks of Ann and Eve go synchronously, Ann sees Eve’s watch almost stopped, and Bob’s watch moving more slowly.All this is in perfect agreement with the theory of relativity. If you accept this behavior as something normal to interpret, I’m happy for you. I prefer to understand through Epstein’s dogma. My model incorporates this dogma but is completed with a mechanical model that any boy can handle.
My model is not intended to formulate a new theory but rather to facilitate the understanding of the orthodox theory, and also to help a better understanding of our space-time universe.
I have looked (so far vainly) for some physical phenomenon that can reveal a difference with the orthodox interpretation, since it is different, although in the end the only thing that affects experimental results are the Lorentz transformations and the two interpretations lead to them. I know that the standard interpretation mathematically explains time dilation and contraction of length, but one cannot understand it from an epistemological point of view. This is what allows some paradoxes such as that of the twins or that of Bell to have the community of physicists divided over their interpretation. Bell proposed his paradox in the 1980s to colleagues at the Center for Theoretical Physics in Trieste and according to him, although the theory was almost 60 years old and hundreds of thousands of physicists studied it at universities, colleagues were divided into two camps. Those who believed that the rope broke due to the contraction of the lengths and the other half did not. He says that he was finally able to convince everyone that the rope was breaking. I have seen that some physicists believe that this shows that the contraction of lengths exerts stress on the object, which I believe is false, (I am sure).
you say “I am skeptical that they will be superior to the standard ones”. Yes but this is not my opinion. you say “I think that Einstein’s original approach, supplemented by Minkowksi diagrams, still offers the best first introduction to special relativity”.may be but, DE GUSTIBUS NOT DISPUTANDUM. I am grateful for the time you have dedicated to me, I am sure that you have much more interesting interests than my feverish speculations.
I am sure that the practice made with our discussions will help me a lot when writing articles and making new videos.
I am busy, so just a quick response.
I am not that Michael Weiss. There are many Michael Weiss’s on the internet.
Sean Carroll is a physicist specializing in relativity, but he is not a historian of science.
Eternalism (the block universe) is not a new idea; in fact, it appears already in Newtonian physics, and is essential for the work of Lagrange (1736-1813), Laplace (1749-1827), and Hamilton (1805-1865). The terms “eternalism” and “block universe” are much more recent, but the idea is old.
The “non-additivity” of velocities is well-understood. The paradox disappears once you think carefully about the “failure of simultaneity”. That is the explanation for just about all the relativity paradoxes. Einstein put his finger on this in his first paper.
The twin paradox does not divide the community of physicists. As I write in my explanation for the physics FAQ, it “has been no more than an entertaining (and educational) exercise since it first saw the light of day.”
The so-called Bell paradox also does not divide the community of physicists. It is a trickier problem, and I’m not surprised that when Bell sprang in on his collegues as a puzzle, many of them found it initially confusing. Epstein has another book, Thinking Physics; it is filled with brain-teasers, most of them having nothing to do with relativity, just Newtonian physics, optics, heat, etc. Paul Hewitt also has a similar book Figuring Physics.
I reject the notion that there is something uniquely difficult about special relativity. Obviously, to master any technical subject requires both a certain level of natural ability and careful study. “There is no royal road”, as Euclid supposedly said to Ptolemy I Soter about geometry.
Possibly when you develop your model, it will offer another useful perspective. I wish you the best.
I reiterate my thanks.